
Your business data is your #1 asset to stay on top of the changing market.
Businesses have a whole plethora of data on their hands. These include sales numbers, customer information to business standard operating procedures, and beyond. And there is a lot to pack in business performance. These are all infinite possibilities of fine-tuning your business success.
Why Conduct Data Analysis?
According to a Forbes study, data analysis can:
- boost worker productivity and cost efficiency by 60%
- and optimize financial performance by 52%.
But all these precious data are useless if you cannot organize them efficiently. Data without a clear, coherent system will derail crucial analysis. That would pinpoint necessary changes to the business flow. Without data visualizations, company executives will struggle to see the root causes of issues.
Choose to run your business as a data-driven organization. Harness your business intelligence to move your business forward. Let your data inform you of what you need to do to stay competitive.
How do you harness your business data?
You must examine your business data from different perspectives. When you can see and compare historical from current data, you can start to make smart business decisions is being served. Viewing your business performance in product or customer view is essential. This guides your decision-makers to see patterns and trends of failures and successes. And they lead to a clear business story. Eventually, you will get actionable insights to plan for a successful future.
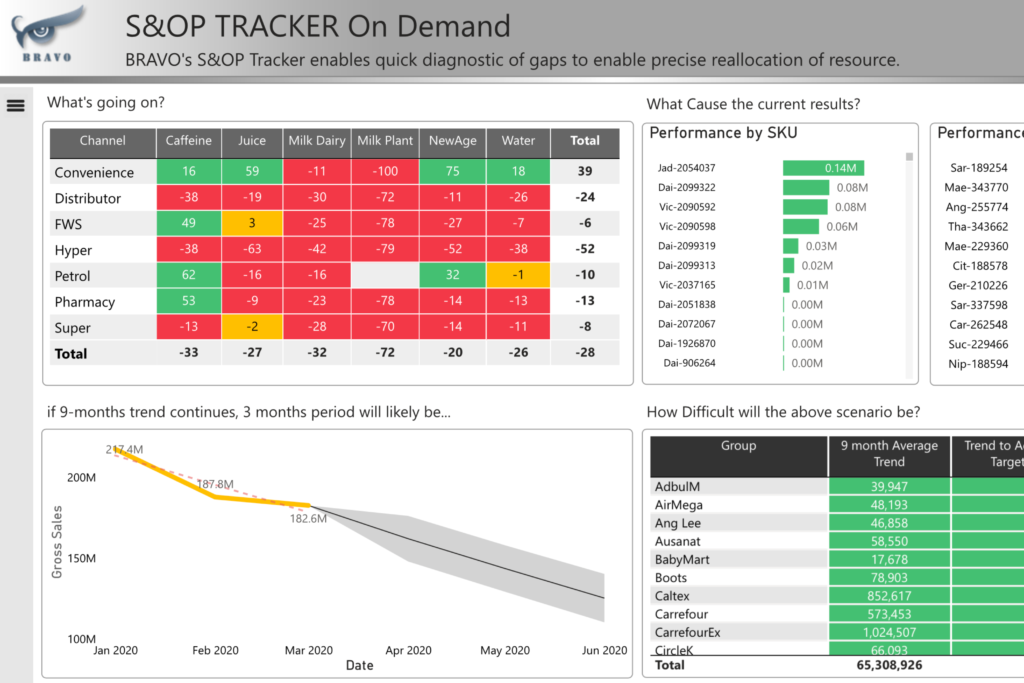
Introducing BRAVO: The Business Performance on-Demand
We, at Datahyv are experts in ERP data visualization. Our team works to uphold the principle of “You cannot improve what you cannot measure.” We can help you implement value-driven solutions by building the best solid data foundation.
To optimize your business operations, you need to free up your data team. Datahyv presents BRAVO Analytics. This is Business Performance on-Demand. Here you will get a bird’s-eye view of your business performance.
We produce data visuals to help you see your business growth within your desired period.
Parts of Business Performance on-Demand
Comparison View of Cumulative Sales Growth
This comparison view consists of a trend line and clustered graph. These graphs show you a month-on-month summary and cumulative sales growth of a particular year from the previous year.
Geographic Heat Map
This shows the sales saturation by location. You can find the sales amount shown by the bubble size per location.
Tabled View of Sales Growth
You can study your business’ Sales Growth Rate through two tables. These compare your sales performance in the selected year from the previous year. The first table shows you the Sales Growth per Product Category. And the other focuses on Sales Growth per Customer.
Check out what Datahyv can do for you
Business Performance On-Demand produces the visualized data of your business performance. This is based on the collective data through DEAR API systems. We measure data, including your sales growth, on a year-long basis.
Data analysis is the best way businesses can thrive amidst the tough challenges of a fast-paced world. Save time, money, and other key resources by listening to what your data shows. Thereafter, learn the art of communicating your data through business storytelling.