
Why other BI tools are slowing you down—and how to fix it.
Do you ever feel like your business data is held hostage? You know the answers are sitting in a database or a massive CSV file, but you can’t get to them. You either have to wrestle with crashing Excel spreadsheets or send a ticket to IT and wait days for a simple report.
It’s time to cut out the middleman. Here is how you can use DataHyv Analytics to go from raw data to live insights without writing a single line of code or installing heavy software.
- Connect or Upload (No Setup Required). Forget about complex data modeling.
- Have a CSV? Just drag and drop your file (even massive ones up to 500MB). Datahyv automatically detects your dates, numbers, and categories.
- Have a Database? Connect directly to SQL Server, MySQL, PostgreSQL, or MongoDB. Unlike other tools that force you to import and duplicate data, DataHyv queries your database live. You see exactly what is happening right now, not what happened yesterday.
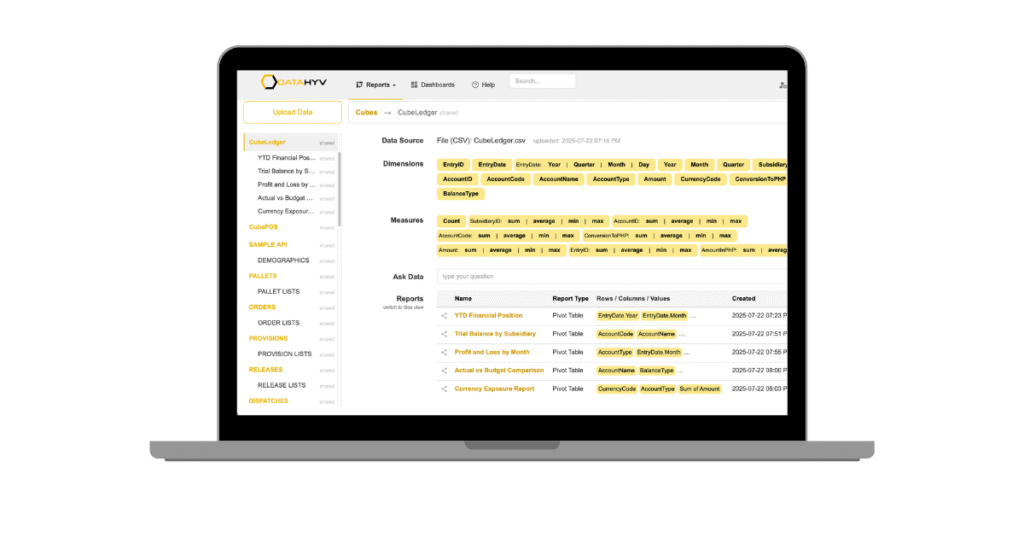
- Ask Questions in Plain English. You don’t need to learn a query language. With the “Ask Data” AI feature, you simply type what you need into the search bar.
- Type: “Show me sales by region for the last 30 days.”
- Result: DataHyv instantly builds the Pivot Table or Chart for you.
- Drag, Drop, and Share. Need to dig deeper? The interface is as familiar as an Excel pivot table but runs in your browser. Drag “Sales” to values and “Product” to rows. Done.
- Share Securely: Instead of emailing insecure attachments, generate a private link or embed the live report directly into your company portal or intranet.
DataHyv vs. The Giants: Why “Bigger” Isn’t Better
While industry giants are undeniably powerful, they are often overkill for agile businesses—heavy, complex, and expensive. The difference starts with accessibility: where legacy tools require desktop installations and specialized analysts to navigate a steep learning curve, DataHyv Analytics is 100% web-based and intuitive enough for anyone who knows Excel to use immediately. Furthermore, traditional BI often relies on “stale” imported data and resource-heavy infrastructure that can slow down your
systems. In contrast, DataHyv utilizes “Direct Query” by default to show you live operational data and leverages DuckDB acceleration to handle millions of rows efficiently without crashing your browser.
Finally, while competitors often hide natural language features behind premium tiers or complex setups, DataHyv provides native AI-powered “Ask Data” insights out of the box, letting you make decisions based on what is happening right now, not what happened yesterday.
“Under-the-Hood” Highlights You’ll Love
- DuckDB Acceleration: We integrated the world’s fastest analytical engine (DuckDB) directly into DataHyv. This means you can analyze massive CSV or Parquet files instantly—something Excel simply cannot do.
- Embed Anywhere: Do you have a client portal? You can embed Datahyv reports using a simple iFrame or API, making your product look professional and data-driven.
- Automated Subscriptions: Set it and forget it. Schedule your sales reports to land in your inbox (or your boss’s) every Monday morning automatically.
The Bottom Line
You don’t need a million-dollar budget or an IT department to get business intelligence. You just need the right tool.
Build this entire report in under 5 minutes using DATAHYV ANALYTICS—no IT knowledge required.